It's not just a cute little ship floating from one point to another.It's the 100% auditable policies that describe how it maneuvers to avoid enemy dirty bombs while still pursuing its goal. It is interpreting information in a new way. |
|
|
It's using "KEEL Technology" to determine "what to do and how to do it". |
Evaluate policies encoded in KEEL to cause a ship to adaptively navigate around a hazardous areas caused by enemy forces dropping dirty bombs in areas where the ship wants to go in order to complete a mission.
If you are interested in how one debugs dynamic policies like this, you may be interested in a paper that demonstrates KEEL "Animation" that allows complex policies to be audited. The same techniques can be used in after mission reviews:
|
Explaining Unmanned Combat Aerial Vehicles - Paper demonstrating how to audit the behavior of Unmanned Combat Aerial Vehicles, March 2009 |
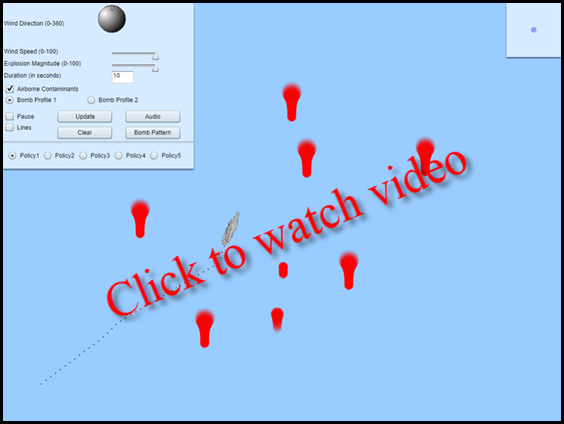
In this demonstration the ship has an objective of going from the lower left corner of the map / display to the blue dot in the upper right corner. This canned path is provided to simplify user interaction with the demonstration.
In the upper left corner of the display the user can control some of the environmental characteristics (wind direction, wind speed, bomb explosion magnitude and duration). Other variables can also be selected. They are defined here.
Wind Direction is controlled by a dial.
Wind Speed is controlled by a slider (with 0 speed with the slider all the way to the left).
Bomb Explosion Magnitude is controlled by a slider (left smaller bomb and right larger bomb).
A checkbox for "Airborne contaminants" is provided. This impacts the bomb profile such that it will disperse over time. Unchecked, the contamination will remain.
A text box is used to set the duration for a bomb to expand. It defaults to a period of 10 (approximately 10 seconds for the demonstration). To change the time enter the new value and click on the Update button.
Radio buttons are used to switch between two bomb profiles: Bomb Profile 1 and Bomb Profile 2.
A "Pause" checkbox is available to pause the system for closer evaluation.
A "Lines" checkbox is available. When this checkbox is checked, a line is drawn from the ship to the nearest bomb. This is helpful in analyzing the simulation, especially if you might have the system connected to the KEEL Toolkit where you could see how all the variables are being integrated together.
A checkbox labeled "Bomb Pattern" is available. Clicking this check box drops a standard pattern of bombs so the different policies can be evaluated against a known pattern.
Five policies are being evaluated for evading dirty bombs in calm and windy conditions.
To drop bombs on the screen, left click on the display. The ship will attempt to avoid the contaminated areas. (You can left click multiple times to drop multiple bombs.) The ship will maneuver around to find a safe way to reach its goal.
Two types of KEEL Engines are used in this demonstration: One type is used to define the bomb Contaminant Distribution Profile and another is used for the Ship's Evasion Policy. Two Contaminant Distribution Profiles have been provided, and five Ship's Evasion Policies have been provided.
The evasion policy describes how the ship is to maneuver when it encounters a contaminated area (bomb). A single bomb is a trivial issue. The ship observes all the bombs that are dropped. It continually monitors this activity. The ship determines the closest bomb and decides how to maneuver to avoid the contaminated area. The closer the ship is to the bomb location, the more radical adjustment to its desired path will be made. There will be times when the ship is avoiding more than one contaminated area (when it is equidistant between 2 bombs). It will alternate between one area and the other and potentially find the safest path between them. In other cases, it will go around all of them. The decision of how to maneuver is also impacted by the wind direction and the wind velocity.
This adaptive policy is good for rapid real-time modifications to its path.
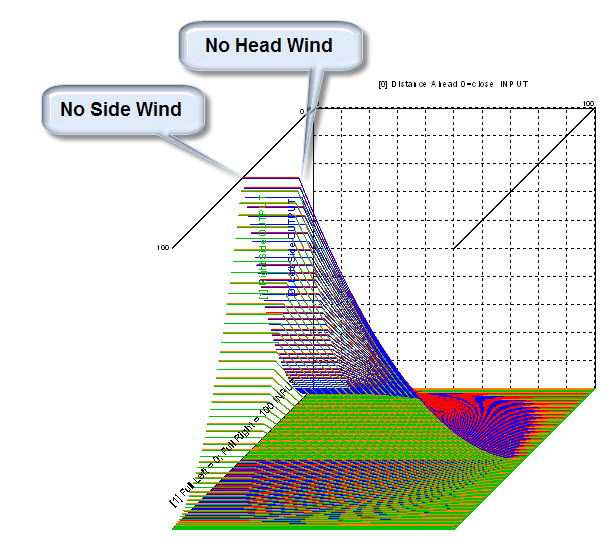
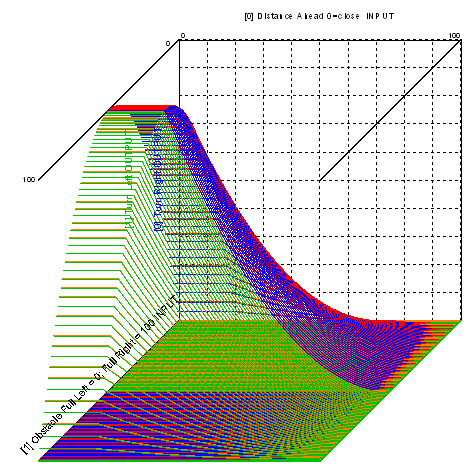
The 3-dimensional curve below shows "Policy 1" for adjusting the desired heading (from 0 degrees at the base to 180 degrees at the top). The maneuver is to the left or right depending on the sides of the curve. The magnitude of the adjustment depends upon how close the danger area is to the front and to the sides. The chart below is for a no-wind situation.
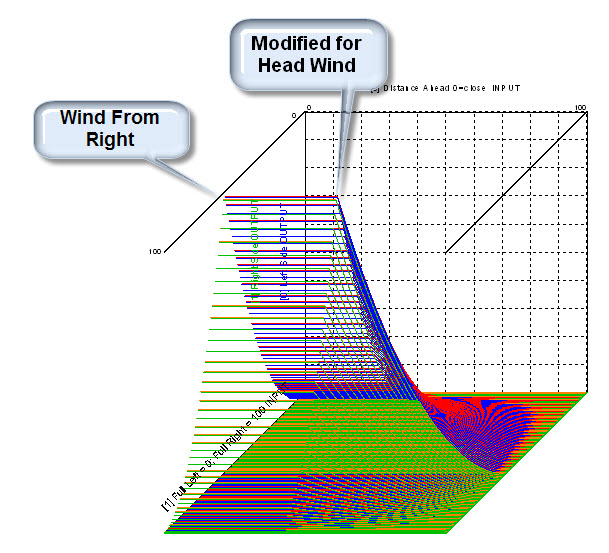
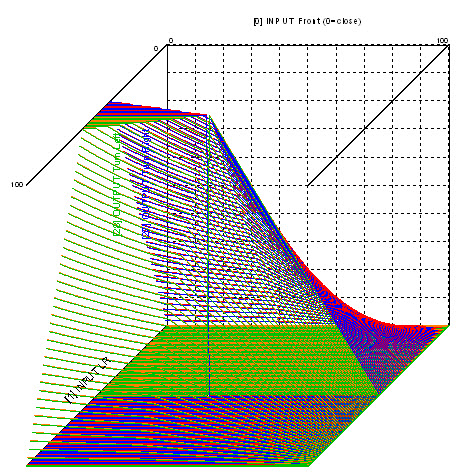
There are cases where the wind may blow the contamination in one direction or another. The curve below shows how the wind impacts the maneuver for Ship Evasion Policy 1. This information is dynamically adjusted during the maneuver, with the objective of keeping safe and also limiting the deviation from the desired path to save fuel.
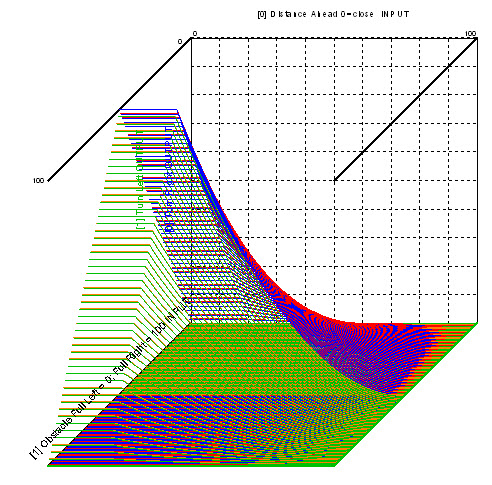
This policy is a very slight modification of Policy 1, except that the impact of wind diminishes when the ship is closer to the bomb. This attempts to avoid steering across in front of a bomb in close proximity to the ship with a crossing wind pattern.
When a bomb explodes there is a rapid distribution of contaminants for a short distance and then a more gradual distribution for the time that the contaminants are airborne. The curve controlling this distribution was modeled in KEEL. To animate this on the screen, the KEEL Engine is called repeatedly (approximately 100 times over its life span (set in the upper left corner of the screen).
Contaminant Distribution Pattern 1 is shown below with the green line. The blue line indicates the gradually reducing intensity of the contaminants as they drift farther from the blast point.

Contaminant Distribution Pattern 2 is shown below with the green line. This model has a non-linear dissipation pattern as the contaminants drift farther from the blast point.

These are demonstrations only and should not be considered ready for deployment. Output data from KEEL Engines are relative (normalized) values. These values would have to be reconciled with real world values (for example, speed of the ship and wind speed) for integration in a production system.
|
Copyright , Compsim LLC, All rights reserved |