Commentary:While this demonstration highlights the use of KEEL Technology to interpret various blood tests in order to diagnose anemia and to explain why other diagnoses might be incorrect, the key point is that all medical tests can benefit from an "automated second opinion" to avoid human error that impacts much of the US medical treatment industry. With the technology that is available today no patient should accept un-audited medical treatment. Any hospital that does provide an automated second opinion should be recognized for their concern regarding patient care and benefit from reduced insurance premiums. |
Documentation is provided below
The intent of this document is to describe the analysis of the blood tests with the objective of identifying possible types of Anemia.
To create the solution Compsim and a hematologist/hematopathologist engaged in discussions to model the thought process that a pathologist might go through to identify a potential disease. A flow chart was developed that defined a forward chaining process. This process looks at one blood test at a time and navigates through a decision tree to determine that a particular disease might be identified or that an unidentified disease might exist (identified when symptoms and test results did not match a pattern for a specific disease). An unidentified disease may indicate the need for additional tests or that some other disease may exist. The problem with the forward chaining approach is that the pathologist is forced to make decisions in series. This is a problem when test results are near boundary conditions. Minor incorrect judgmental decisions early in the sequence can lead to erroneous paths being pursued that results in faulty diagnosis. In these cases it is often hard to identify the impact of the small interpretation error early in the process.
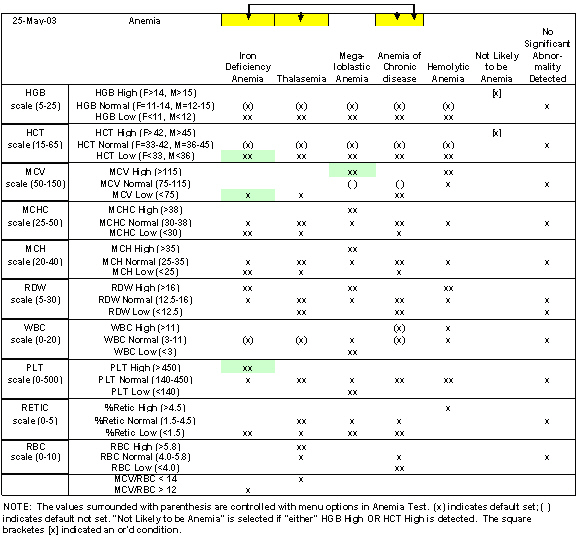
During the discussion process, an Excel spreadsheet was developed that identified the characteristics of the different diseases: Iron Deficiency, Thalasemia, Megaloblastic, ACD (Anemia of Chronic Disease), Hemolytic Anemia, No Anemia, Unspecified Blood Disorder, and No Significant Abnormality Detected. (Normal).
The spreadsheet identifies possible characteristics of each disease. Should a patient exhibit the characteristics that are inconsistent with that disease, then that disease is eliminated from the list of possible diseases. As the system reviews each blood test it eliminates each disease that is inconsistent with the test results. Blood tests that are not used in evaluating a particular disease are not used to eliminate that disease.
This means that blood tests inconsistent with a particular disease will eliminate that disease as a possible diagnosis.
Using KEEL Technology to model the decision-making process allows all of the test results to be evaluated together. There is no sequential process that may lead to improper diagnoses. All results are interpreted.
The spreadsheet documented the normal range of values for each blood test for each disease. Additionally, the absolute minimum and absolute maximum reading for each blood test was recorded. In some cases, AGE and GENDER impact the normal ranges for each disease.
A few special cases are handled:
NOTE: These configuration parameters were used to test the KEEL model based on the alternative models. A production unit would be based on CDC guidelines.
The following spreadsheet documents the discussion that defines the structure of the Anemia Test program.
The challenge for the human pathologist is that he/she is responsible for correctly interpreting approximately 250 combinations of readings to make a correct diagnosis. It is easy for "humans" to become biased toward certain diagnoses without looking at "all" the data.
The development process requires that curves are prepared that identify the normal range for each of the blood tests. The KEEL Toolkit allows the user to create and graph these relationships. In this version of the Anemia Test application, the point in the Y axis where the curve crosses the 10% level is an indication of the normal range. See the image below:
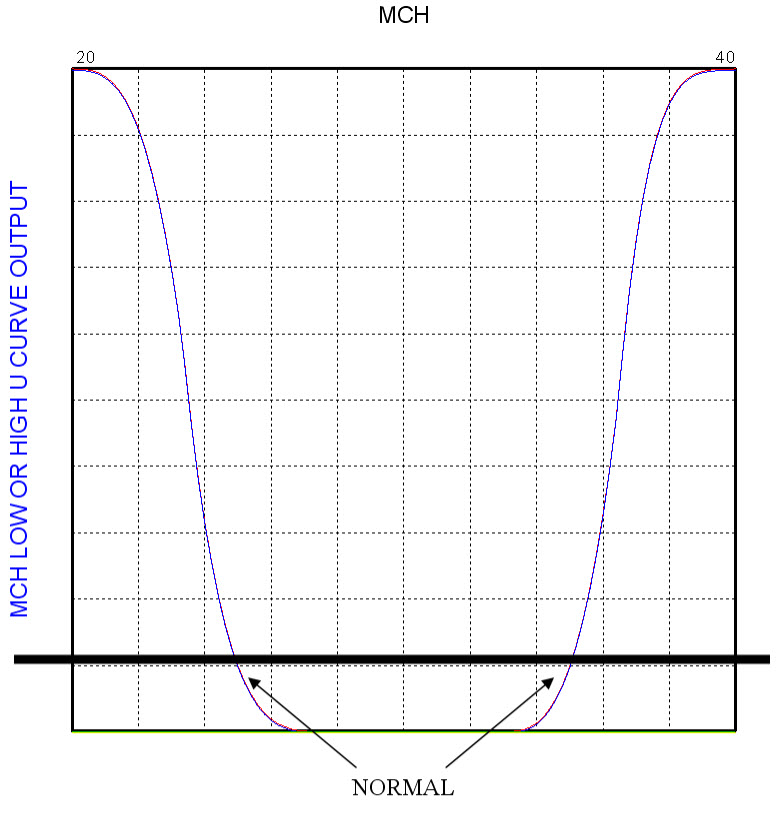
The curves allow us to capture the confidence level where each blood test is consistent with each disease. These confidence levels have not been tuned to indicate confidence for a particular disease.
![]()
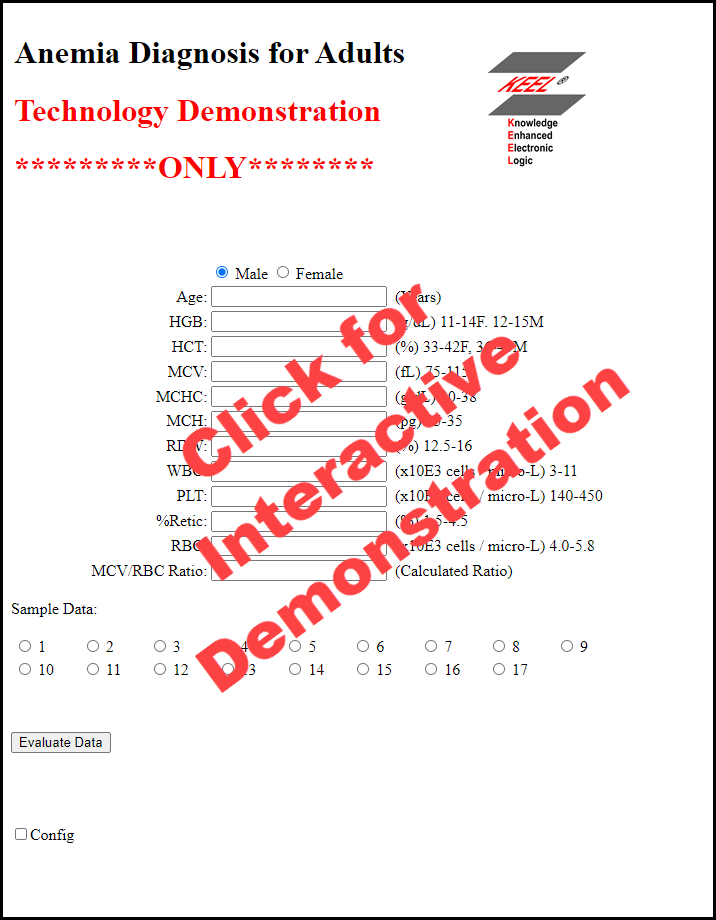
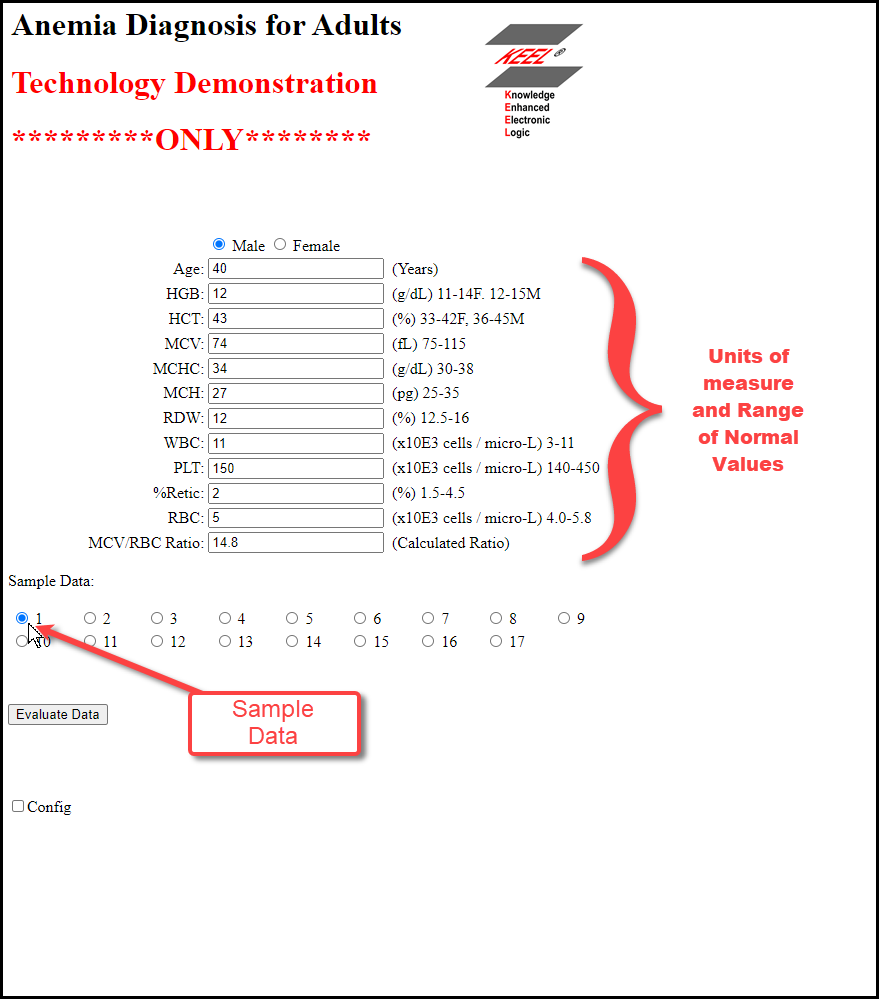
To work with this demonstration you can enter data into the fields that come from the hematological analyzer, or you can choose to use some sample data by selecting radio buttons near the bottom of the screen.
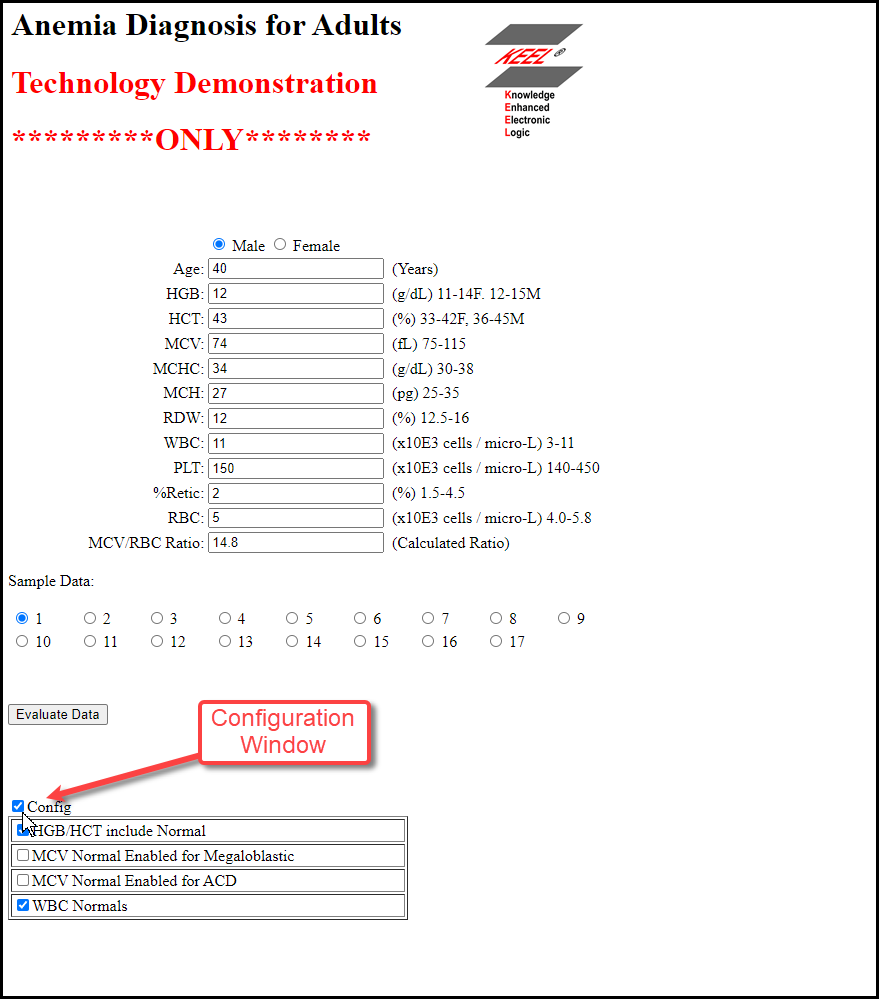
As mentioned earlier, some modifications to the cognitive model can be made. The CONF check box in the lower right opens a small window for selecting the different configuration options.
To the left of the Text Fields are the titles of the readings.
To the right of the Text Fields are the units of measure of each reading and the lower and upper limits for Normal readings. Note for HGB and HCT the ranges for Normal values are different for male and female.
When the data has been loaded, click the Run button to analyze the results using the KEEL Engines.
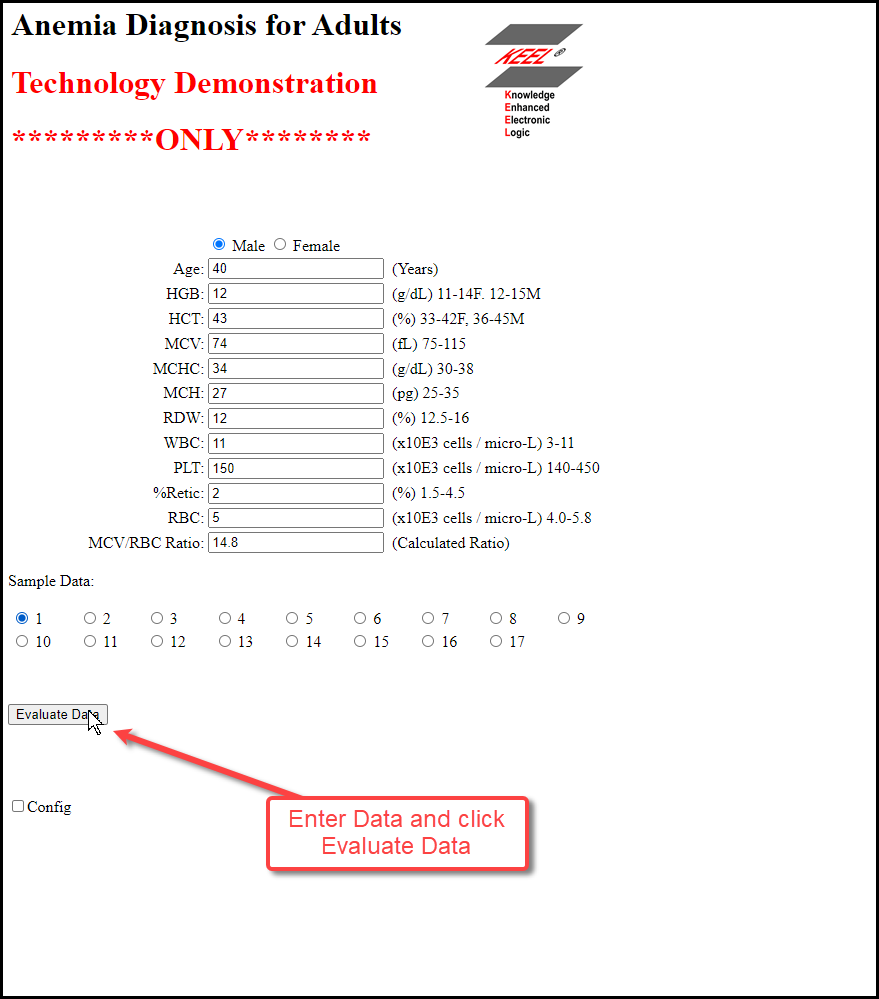
When the user clicks the Run button, the data is supplied to the KEEL Engines. All of the data is interpreted and the results are returned.
The diagnosis (if it is possible to make one), is displayed below the Run button.
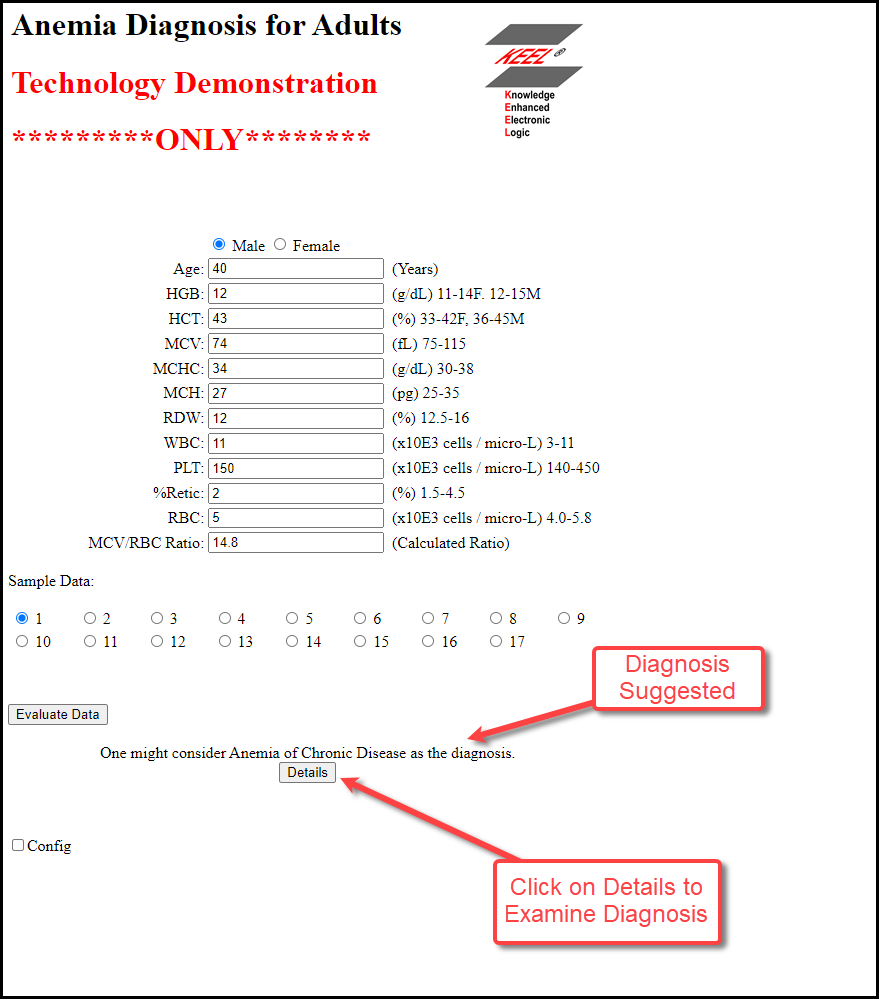
Below the diagnosis, a new button is displayed. The Details button provides some background information to support the diagnosis. Clicking this button opens the Details Window.
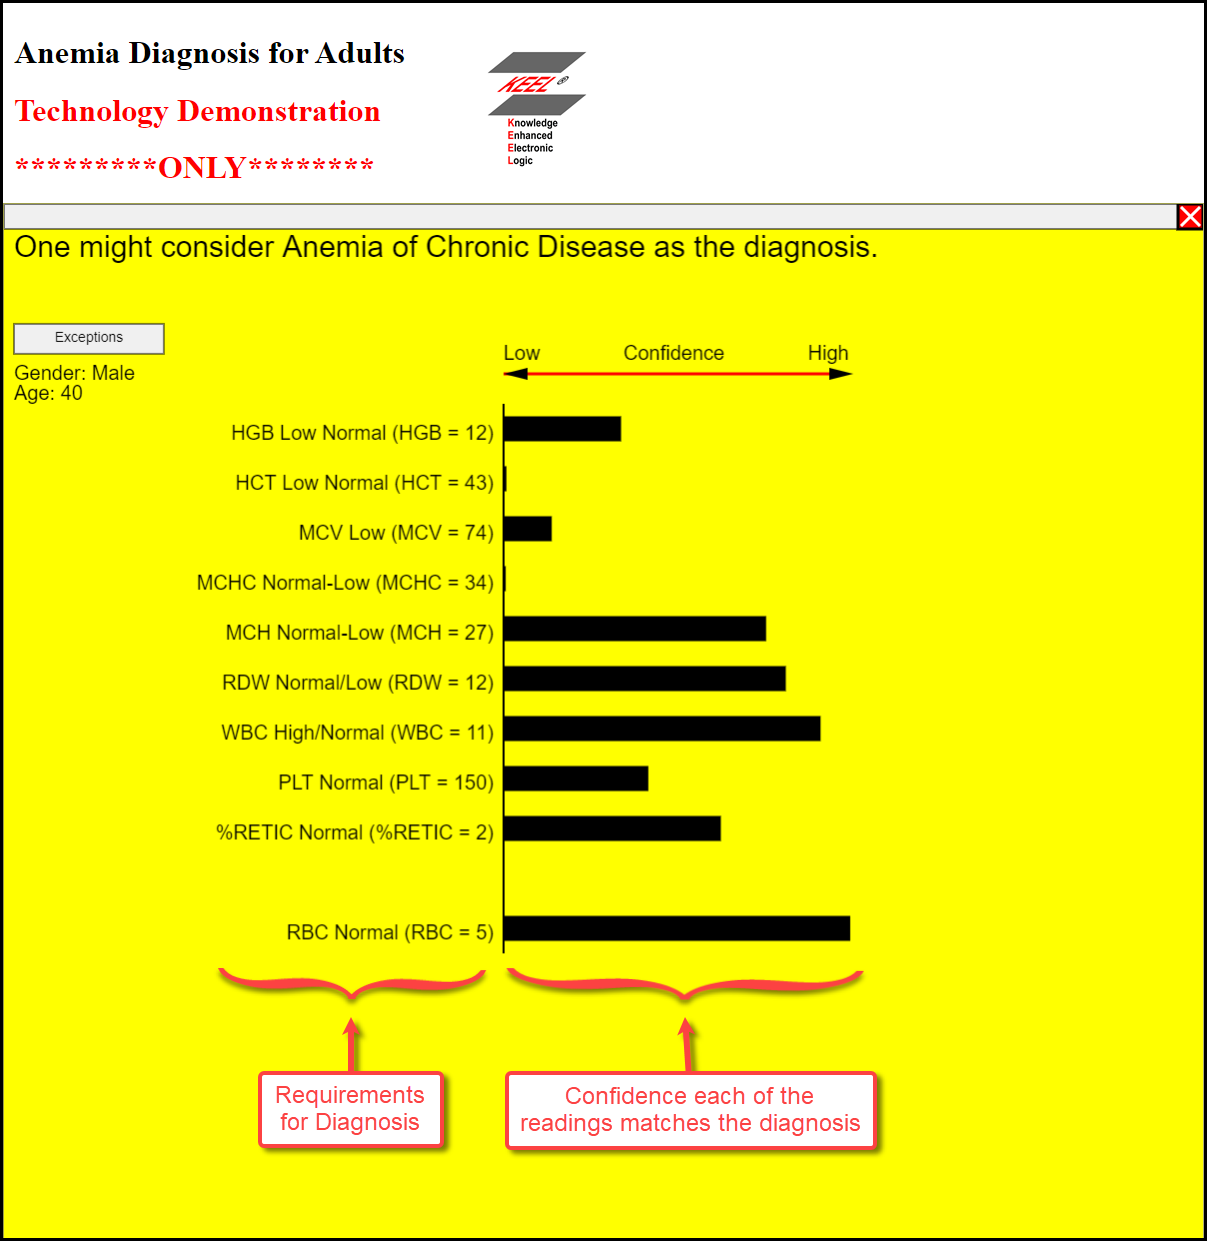
The Diagnosis is restated at the top of this window.
Below it (to the left) are the criteria (from the spreadsheet) that describe the characteristics of the diagnosed disease. To the right are bars whose width show the confidence that each of the readings matched the characteristics of the disease. Because humans are analog machines it is likely that no diagnosis will be based on 100% confidence. For this reason, it may be vary important to understand why diagnoses may not have been identified. To support this concept, the Exceptions button is provided that can highlight why other diagnoses were not selected.
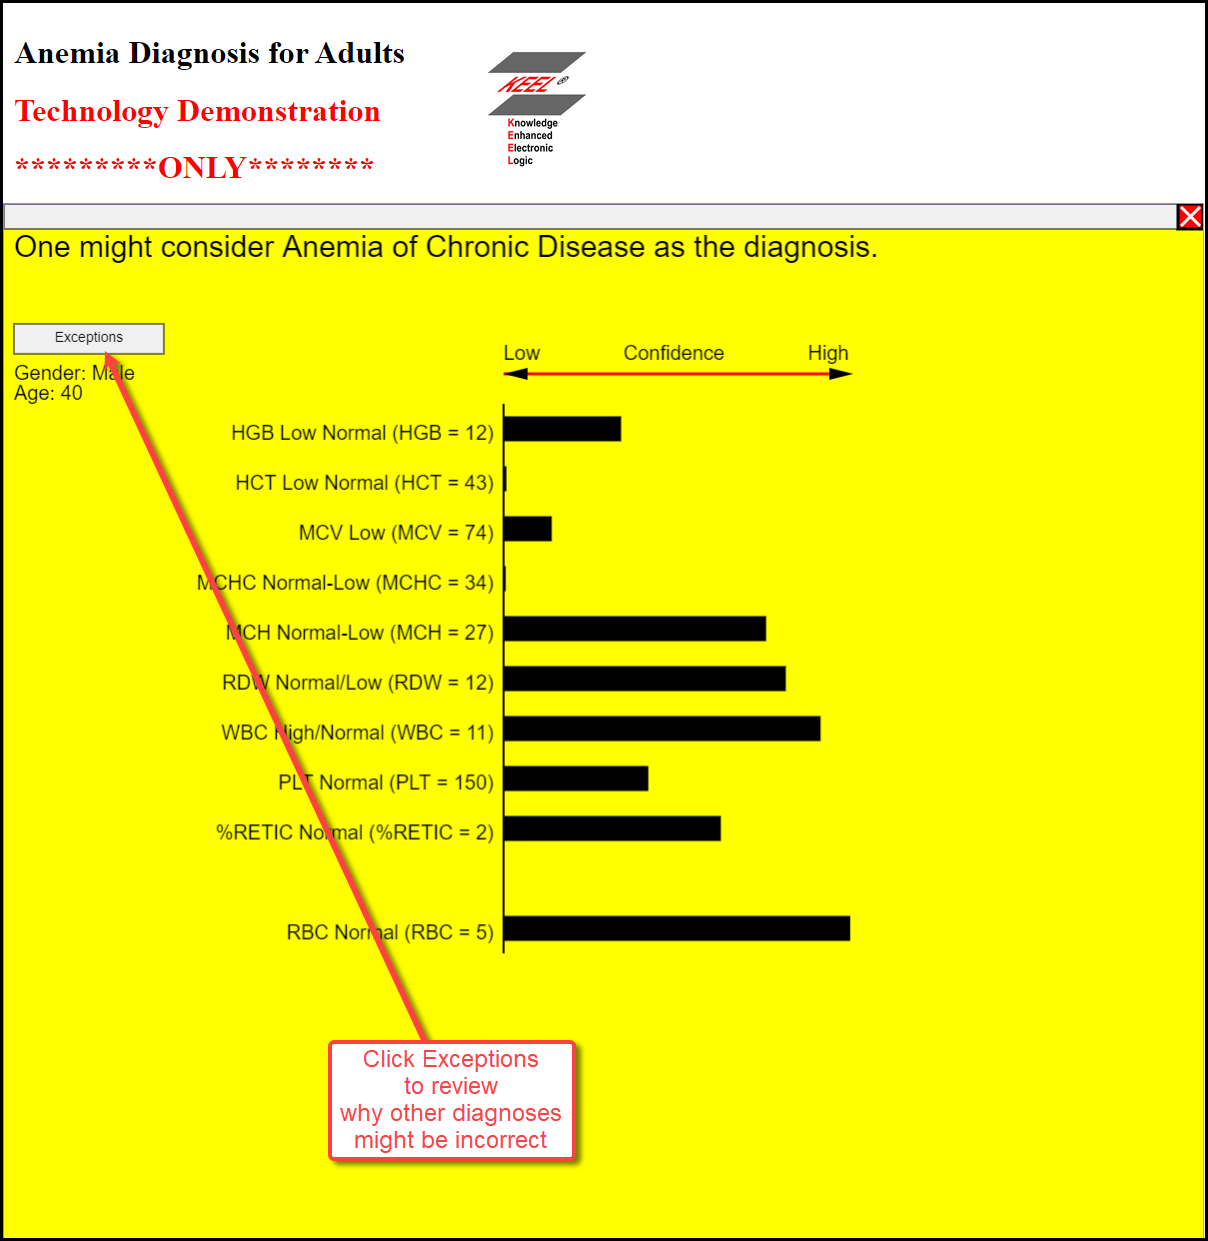
The example shown in this document shows a case where ACD was diagnosed. The Exception chart below shows why other diagnoses were not selected. The red bars show how near certain readings were to values that might have indicated another disease.
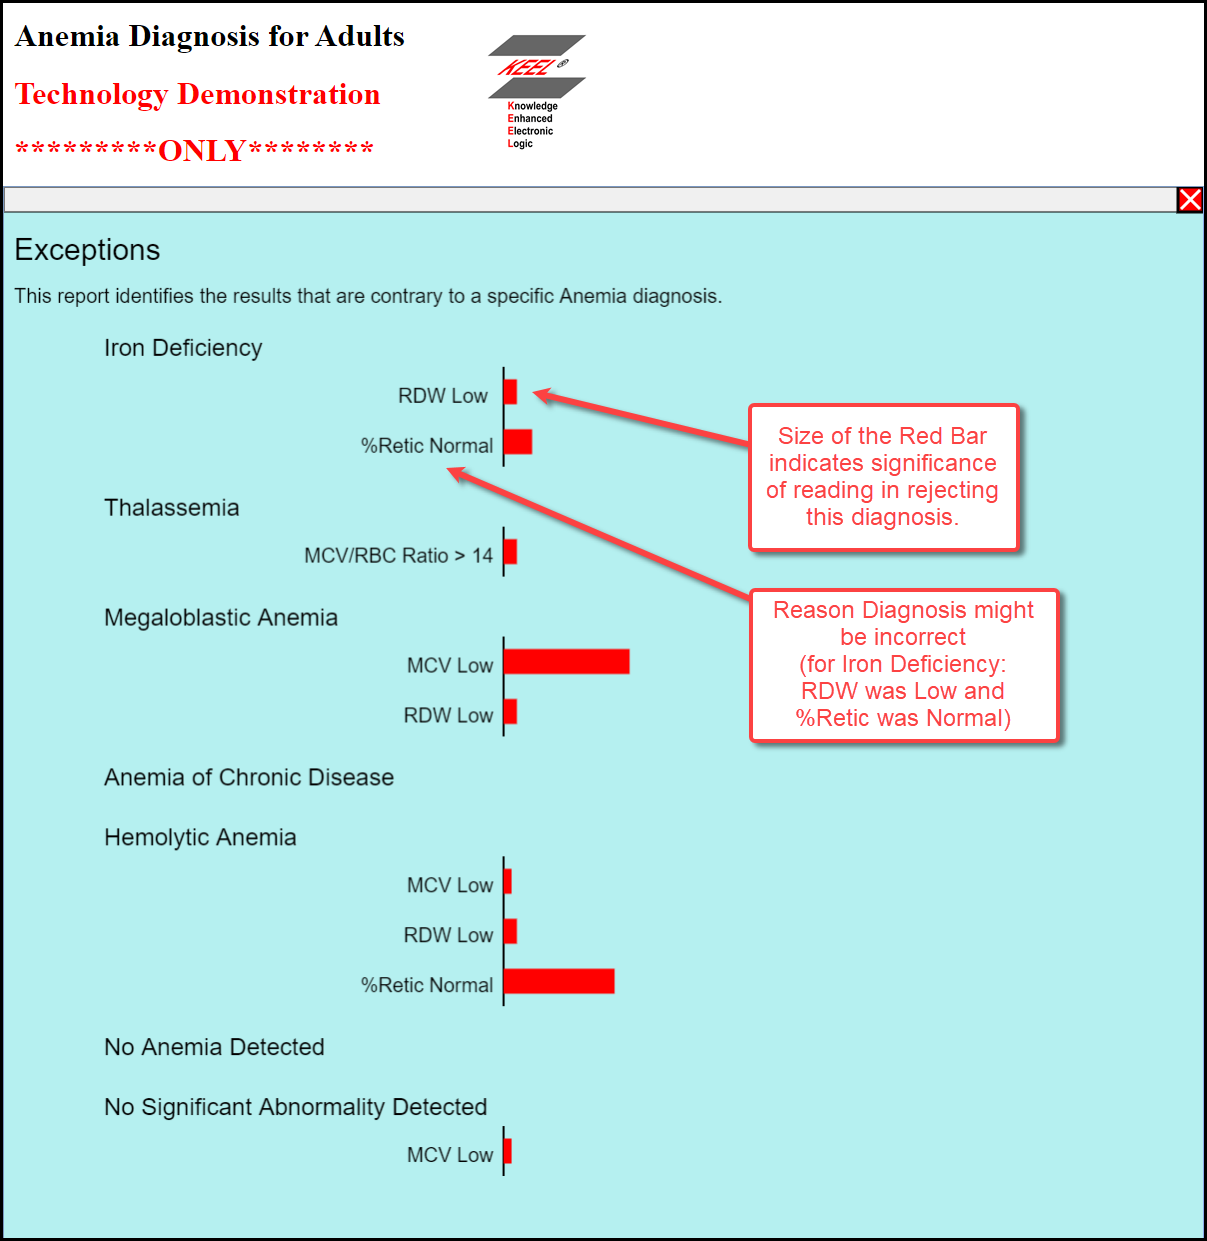
In some cases one might encounter an unspecific blood disorder and the exception report might indicate that a single reading was just outside the range for a "standard" diagnosis. The pathologist might be able to ask a question of the patient that would help "tune" the interpretation of the data. These questions could be built into the system for a more automated approach. The Exception report below shows only a single reading that blocked the diagnosis of ACD.

This application uses a number of KEEL Engines integrated into a single solution with the KEEL Function Block integration tool.
Each KEEL Engine is created with the KEEL toolkit to create curves that show low, normal, and high values for each of HGB, HCT, MCHC, MCH, RDW, WBC, PLT, %Retic, RBC, and MCV/RBC ratio. (An example is shown earlier in this document for MCH.) Each curve has thresholds set that turn on/off indicators that allow another KEEL engine that accepts the reasons that each disease should not be considered.
For example, per the spreadsheet information above, Iron Deficiency Anemia should not be detected if RDW is low. Using the reverse chaining approach, an RDW low reading would eliminate Iron Deficiency from the considered list of diseases.
This "reverse chaining" approach will yield "Unspecified" if all other options are rejected for one or more reasons.
When a single diagnosed disease is detected, the strength of each reading (per the importance identified by the pathologist) is graphed. This forward chaining extension (not completely tuned in this phase) will be used to highlight the confidence of each reading in line with the disease suggested for consideration. In this way a disease would show a short bar if the reading was just barely consistent with the expected readings.
A number of options are integrated into the solution that can be turned on/off to evaluate their impacts during the research phase.
Another advantage of the use of KEEL technology is the ability to include dynamic ranges that can be manipulated. The most common use of this ability would be to use age to define changes in normal ranges. There are some cases today where different normal ranges are set for infant, child, teenager, adult. The step changes in "normals" suggest that overnight a human changes according to these same step changes. With KEEL curves, gradual changes in "normals" can be integrated into a complete solution.
|
Copyright , Compsim LLC, All rights reserved |