KEEL Technology provides a way to create, test, package, audit, and explain human-like reasoning. The KEEL "dynamic graphical language" provides an "easy to use" approach for creating what might otherwise be a very complex formula. This demonstration shows how the KEEL language implements a very simple formula. In this case there are 2 linear inputs that are combined to produce 1 output. An automatically generated KEEL cognitive function (KEEL Engine) processes the functionality behind the scenes. In more complex problem domains, there are no software limits to the number of inputs , the number of outputs, or the number and type of functional relationships between information items that are simultaneously processed (as if it was a single formula).
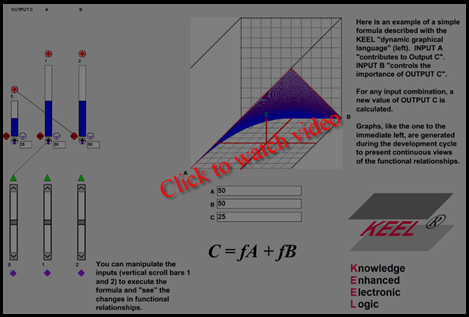
In the KEEL "dynamic graphical language" (shown in the screen shot at the left side of the demonstration below), the vertical bars at the top represent outputs that can either be exposed to the external environment or can be used internally. Outputs represent relative (analog) decisions or actions. The height of the output bars is an indication of the importance of this piece of information (decision or action).
The vertical scroll bars, grouped below the outputs represent inputs. The indicators above the scrollbars (red and green) indicate whether they hinder or drive the output they are associated with. (This example only has green driving inputs.)
The wires shown in the window define specific functional relationships that describe how information is related. In the development environment, these wires are created with simple drag and drop mouse actions. As soon as inputs and outputs are dropped on the screen and as the links are made, the system reacts to the simulated inputs (the scroll bars). In this way the designer can see immediately how changes in the inputs propagate through the system. Unstable designs are caught by the design environment.
The demonstration above allows you to provide inputs to the formula (embedded in a KEEL Engine) and see the results in a text box and in the animated graph, the demonstration below allows you to interact with the KEEL source code and see the animation of the graph. In both cases, the identical KEEL "engines" are processing the formula.
A user will use the KEEL Toolkit, which utilizes the KEEL "dynamic graphical language", to define functional relationships between data items (ie. create the formula). The user will interact with the design, as shown above, to test the functional relationships to see that they perform as desired. Occasionally the user will graph the results to get a view of inputs that change over the range (0 to 100) and see the impact on the outputs. No graphs are saved, only the "formula" described with the dynamic graphical language.
When the design (formula) is satisfactory, the design is saved as a KEEL "Engine", which is a source code "function" or "class method" (depending on the output language of choice: C, C++, C++ .NET, C#, Java, Visual Basic, VB .NET, etc). This code (created as a text file) can be integrated into the user's project development environment to integrate the functionality into production or simulation environments.
In this example, the functional design was created with the KEEL Toolkit. The 3-D graph above was created from within the Toolkit. The design was orignially saved Actionscript "code" for rendering on a web page.
|
Copyright , Compsim LLC, All rights reserved |