Businesses are often faced with decisions that require the selection from among options that are cost sensitive. It is not sufficient to "just" pick the lowest cost solution, because the options are commonly not equal for one reason or another.
These decisions are never as simple as just taking the lowest cost. The decision often requires the subjective evaluation of soft data. Still humans are continually confronted with the challenge of making the most cost effective decisions. This simple demonstration shows how KEEL cognitive modeling can be used to create explainable / auditable cost effective decisions.
| More complex decisions: KEEL can be used to model much more complex business decisions. For example, one might want to model business rules. |
This is a very high level application that takes into account only two (2) subjective values. It is likely that a customized application will include much more "knowledge" about how to make these subjective valuations. All of this can be integrated in the KEEL cognitive models with relative ease. No math and no programming skills required.
The following example was originally coded in Macromedia Flash. It had an embedded KEEL Engine that integrates the various data items and determines which option is most cost effective.
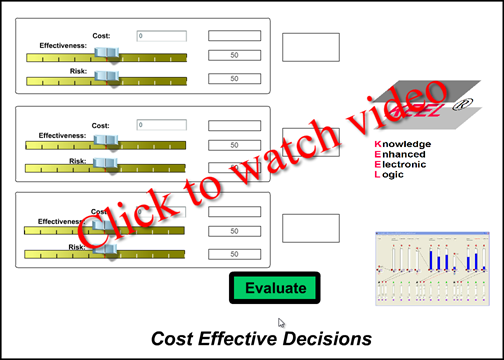
This application creates a cost effective selection between three options. The user identifies the costs of the three options and then rates them for effectiveness (slider bars to the right are the most effectiveness), and rates them for associated risks (slider bars to the left have less risk and to the right have more risk).
Click on the "Evaluate" button to see the results of the integrated data values. The results appear as numbers between 0 and 100, with the option with the highest rating being the most cost effective.
NOTE: It is possible to have the application drive the source code (shown below the application window) to allow the designer to "see" how the data is integrated. It is in this manner that subjective inter-relationships can be evaluated for audit purposes and changed if necessary.
Assumption: The cost of the options is non-trivial. Here is an example of a trivial cost example: The cost of the most expensive option is $.10. The least expensive option is $.05. Assuming the budget is $10,000 and only a few items are needed, then there is no purpose worrying about cost.
To provide an input to the KEEL engine for the cost associated with each option, take the most expensive option and scale the others against it.
Option 1 costs $90, Option 2 costs $80, and Option 3 costs $75.
In this case, the delta between lowest and highest is $15.
((15 / 90) * 100) or 16.7% would be the negative impact on Option 1.
(5 / 80)*100) or 6.25% would be the negative impact on Option 2.
There would be no negative impact on Option 3.
Option 1 costs $390, Option 2 costs $180, and Option 3 costs $75.
In this case, the delta between lowest and highest is $315.
((315 / 390) * 100) or 80.7% would be the negative impact on Option 1.
(105 / 180)*100) or 58.3% would be the negative impact on Option 2.
There would be no negative impact on option 3.
Note: Sometimes there are primary and secondary costs (like acquisition costs and operating costs). If this is the case, then it may be appropriate to consider the total costs over the project lifetime or total costs over x years. When considering costs, one of the options that should be considered is the cost of not doing anything. This option can be eliminated if the effectiveness of this option does not meet the minimal level of effectiveness.
In addition to "cost", the decision must take into account option effectiveness.
Two concepts might be used.
First, for an option to be considered it must meet some minimum level of effectiveness. Failing to provide that level of service requires that it be dropped from consideration. (This service is not included in this demonstration.)
Second, the level of effectiveness must be measurable. It can be measurable against some gold standard. Alternatively, the options can be compared against the most effective option. It is suggested that comparison using an abstract standard is most appropriate. It is also suggested that an option that performs above the maximum level of performance needed is of no additional value.
Where cost is at least somewhat quantifiable, effectiveness may be more difficult to "value".
One simple approach would be to provide a scrollbar and allow the user to make a subjective evaluation. A subjective evaluation is often performed by a human using "right brain" services. The right brain processes images and makes judgment probably using some kind of "balancing" interpretation of data. A scroll bar also uses an image that is dynamically adjustable and therefore does not require the human to "translate" between an image and a number.
Secondary Benefits:
In some cases there may be some secondary benefit to a process that "might" be used in an analysis.
For example, a byproduct of a process may provide some income that might be able to offset some of the life cycle costs. There might also be some other "soft" offshoots (political) that might be used in the analysis. We might suggest that it would be best to translate these benefits to some financial value, and use them to offset the financial costs.
There might be some other "risks" associated with a particular option. "Schedule for implementation" might be one example. Like the secondary benefits, it may be best if these risks can be translated into some "cost" impact and included in the life cycle cost rollup.
Contact Compsim for an in-depth discussion of this demonstration or any of the others.
|
Copyright , Compsim LLC, All rights reserved |