NOTE: This is a 'rendering' of the KEEL dynamic graphical language. This represents an approximation of what one sees when developing the reasoning models with the KEEL Toolkit. The KEEL Toolkit includes a collection of system engineering, reporting, and support tools to assist in the design, testing, visualization, and packaging of the cognitive models.
It is strongly recommended that you contact Compsim (262) 797-0418 to request a short introduction to this demonstration if you are interested in learning how this language works, including additional features not shown in this demonstration
View Combo Box (in upper left corner of the rendering window):
The View Combo Box allows you to select different
views of the language. The designer could have created "named views" (not used
in this example). Parent and child views area also available. For example:
Select the Importance Icon for Action 2:![]() and
select Child View from the Combo Box. This will show Action 2 and the children
of Action 2 (Action 3 and Action 4). Similarly select the Importance Icon for
Action 2 and select Parent View from the Combo Box. This will show Action 2 and
the parents of Action 2 (Action 1).
and
select Child View from the Combo Box. This will show Action 2 and the children
of Action 2 (Action 3 and Action 4). Similarly select the Importance Icon for
Action 2 and select Parent View from the Combo Box. This will show Action 2 and
the parents of Action 2 (Action 1).
The KEEL Dynamic Graphical Language allows the user to interact with the logic before committing the design to production.
In this example, the resolution of the first component (Action 1) of the domain impacts both the second component (Action 2) and the third component (Action 3). It controls the importance of the Action 2. It controls the threshold of Action 3 which can turn off or on Action 4. Action 2 also contributes to Action 3.
The relatively simple wiring constructs of the language allow very complex relationships to be established with relative ease. The immediate feedback provided to the user supports a rapid development and test process.
And, unlike the human written and verbal language, it is completely explainable and auditable; just like a mathematical formula. It does not require a mathematician, however, to audit the results.
The vertical bars at the top of the window above represent outputs that can either be exposed to the external environment or can be used internally. Outputs represent relative (analog) decisions or actions. The height of the output bars is an indication of the importance of this piece of information (decision or action).
The vertical scroll bars, grouped below the outputs represent inputs. The indicators above the scrollbars (red and green) indicate whether they hinder or drive the output they are associated with.
The wires shown in the window define how information is related. In the development environment, these wires are created with simple drag and drop mouse actions. As soon as inputs and outputs are dropped on the screen and as the links are made, the system reacts to the simulated inputs (the scroll bars). In this way the designer can see immediately how changes in the inputs propagate through the system. Unstable designs are caught by the design environment.
In this example, you can adjust the scrollbars (that are not controlled internally - inputs 0,1,2,3,4,5,6,7, and 8) and see the system rebalance.
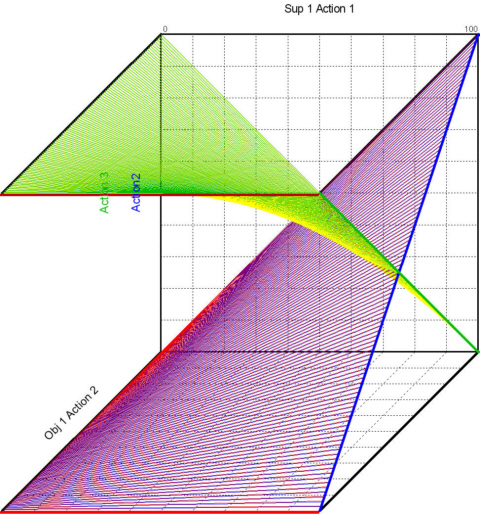
The graph below shows the interaction between Input 0 and 8 against Outputs "Action 2" and "Action 3" with Input1, 2, 3, 4, and 7 held at 0 and Input 5 at 100.
NOTE: You can manipulate the design by interacting with the rendering of the design at the beginning of this webpage. In this case, the model was rendered in JavaScript as a KEEL "design". This engine is then used to control the interaction between the objects, just as if one was manipulating the graphical objects within the KEEL Toolkit. The only difference is that with the rendering, we have not allowed you to edit or change the design.
.